Your security team is likely drowning in alerts. A cloud scanner flags a misconfigured S3 bucket. An identity tool reports an unused user permission. A firewall logs a suspicious IP address. Each alert is a single, isolated dot. In a large organization, you get thousands of these dots every day.
The real question is: which dots matter? And more importantly, how do they connect?
The problem with modern security is that it’s dominated by "point solutions", tools that are excellent at finding individual dots but are blind to the bigger picture. They can't tell you that the misconfigured S3 bucket contains sensitive data accessed by a service that can be reached via the suspicious IP.
To see the full story, you need to stop looking at lists and start looking at networks. This is the power of graph-based data security, an approach that connects the dots to reveal hidden risks and stop attacks before they escalate. Data Journeys is the engine for this approach. Learn how our technology builds the live, graph-based map of your data ecosystem.
Summary of key insights:
- Graph model: nodes (assets) + edges (relationships)
- Path analysis to uncover attack chains
- Centrality to spot high-risk “hub” assets
- Context-rich alerts from a unified security graph
Why point solutions fail
Point solutions have created silos of security data. Your cloud security tool knows your infrastructure, your identity provider knows your users, and your application scanner knows your code vulnerabilities. But none of them can give you a single, unified answer to a critical question like:
"What is the full blast radius if this specific developer's credentials are leaked?"
Answering that requires you to manually stitch together data from five different systems. By the time you have the answer, it's often too late. This fragmented view leaves you vulnerable because attackers don’t operate in silos. They move laterally, chaining together seemingly minor weaknesses to create a path to your most valuable data.
The power of connection
A graph-based approach fundamentally changes how you view your data ecosystem. Instead of a collection of separate assets, you see it for what it is: a deeply interconnected network. This is the essence of data topology mapping.
Think of it like the difference between a simple list of city names and a dynamic map like Google Maps. The list tells you the cities exist. The map shows you the roads connecting them, the traffic patterns, and the fastest route from A to B. In security, network analysis provides that map, showing you the pathways an attacker could take.
The building blocks
In a security graph, every asset becomes a "node," and every relationship becomes an "edge."
- Nodes (The things): These are your entities, a user, a database, a microservice, an S3 bucket, a code repository, or a piece of sensitive PII.
- Edges (The relationships): These are the connections and actions between them "has permission to access," "reads data from," "is deployed in," "processes," or "contains."
Suddenly, your environment is no longer an endless spreadsheet of assets. It's a living, breathing map of connections.
Path analysis and centrality
Once you have this map, you can ask much more intelligent questions.
Path analysis algorithms allow you to find hidden attack chains. You can query the graph to discover, "Is there any possible path from a public-facing, vulnerable application to our customer credit card database?" The graph can instantly trace the sequence of permissions and data flows often through multiple unexpected hops to reveal a critical risk that no single point solution could ever see.
Furthermore, centrality metrics help you identify your most critical and riskiest nodes. You can instantly see which user account has the most "super-connector" permissions or which database is the most interconnected with sensitive data flows. This allows you to prioritize your security efforts on the assets that pose the greatest risk if compromised.
Making sense of complexity
The most powerful aspect of a security graph is its ability to make incredibly complex relationships understandable at a glance. A well-designed graph visualization can immediately show a security analyst the blast radius of a compromised asset, helping them understand the full context of an alert in seconds, not hours.
How Relyance.ai builds the true security graph
The theory of graph-based security is powerful, but a graph is only as good as the data feeding it. If you build your graph by simply ingesting alerts from your existing point solutions, you are just connecting the same old dots. You're not discovering the unknown unknowns.
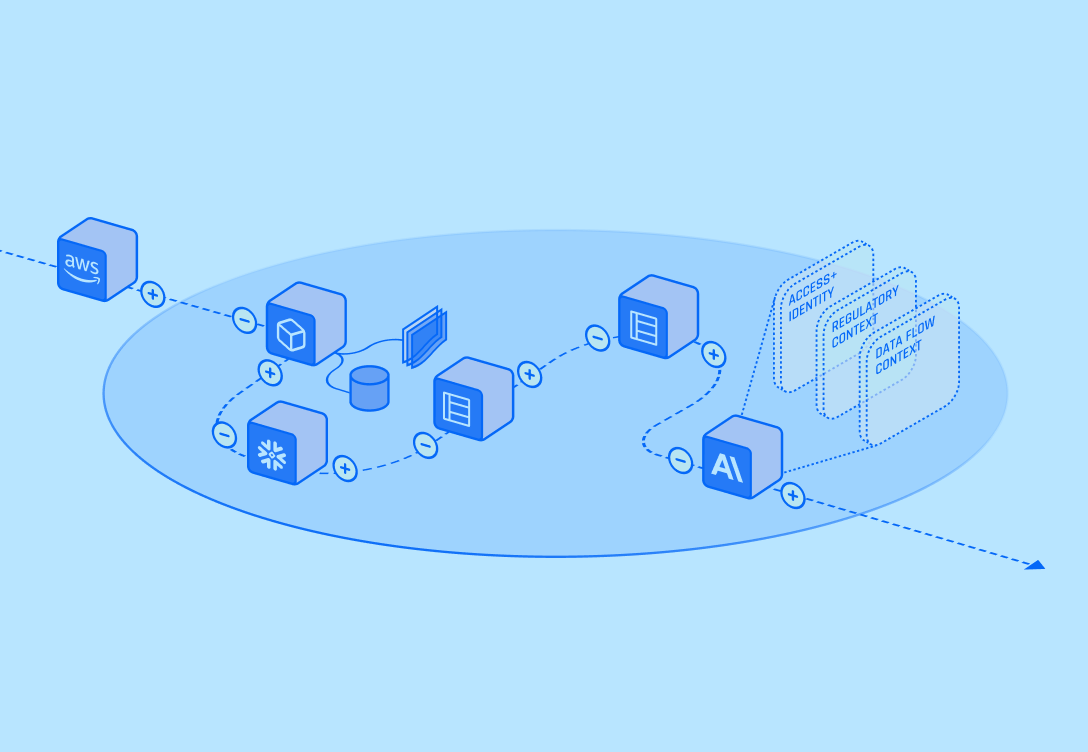
Relyance.ai builds a unified, real-time map of data flows (Data Journeys™) starting at the code/API layer and observing how sensitive data moves across systems.
- Discovering every node and edge, automatically: We use a code-first approach plus real-time observation to auto-discover key data stores, services, APIs, identities, and sensitive data, then map the actual flows and relevant permissions between them for a high-fidelity data topology.
- Revealing the true attack path: Because our graph is built on the reality of how your code works, our path analysis is higher-fidelity. We can show service/function pathways that read from one data store and write to another, revealing how data actually propagates. This allows you to spot privilege escalation risks and latent data leaks that are invisible to other tools.
- Providing context, not just alerts: When Relyance.ai flags an issue, it's not an isolated dot. It's a finding that is enriched with the full context of the security graph. You can immediately see what the asset is, what sensitive data it touches, who has access to it, and how it connects to the rest of your ecosystem. This turns a low-context alert into high-value, actionable intelligence
Relyance.ai doesn't just talk about graph-based security; our entire platform is built on this principle to provide the deep, contextual intelligence that modern security teams need.
Connect the dots before the attacker does
Operating without a unified, graph-based view of your data ecosystem is like trying to defend a city with security guards who can only see their own street corner. You're blind to how an intruder can move from one block to the next.
By embracing a network analysis approach, you can move from a reactive, fragmented security model to a proactive, holistic one. You can see the full picture, understand the true blast radius of any threat, and prioritize the risks that actually matter. It’s time to stop collecting dots and start connecting them.